Overview
AccelProf is a modular, extensible, and low-overhead framework for performance analysis on heterogeneous accelerators such as NVIDIA and AMD GPUs. It offers a unified profiling interface that bridges low-level hardware event tracing with high-level deep learning (DL) framework insights, making it an effective tool for analyzing modern workloads.
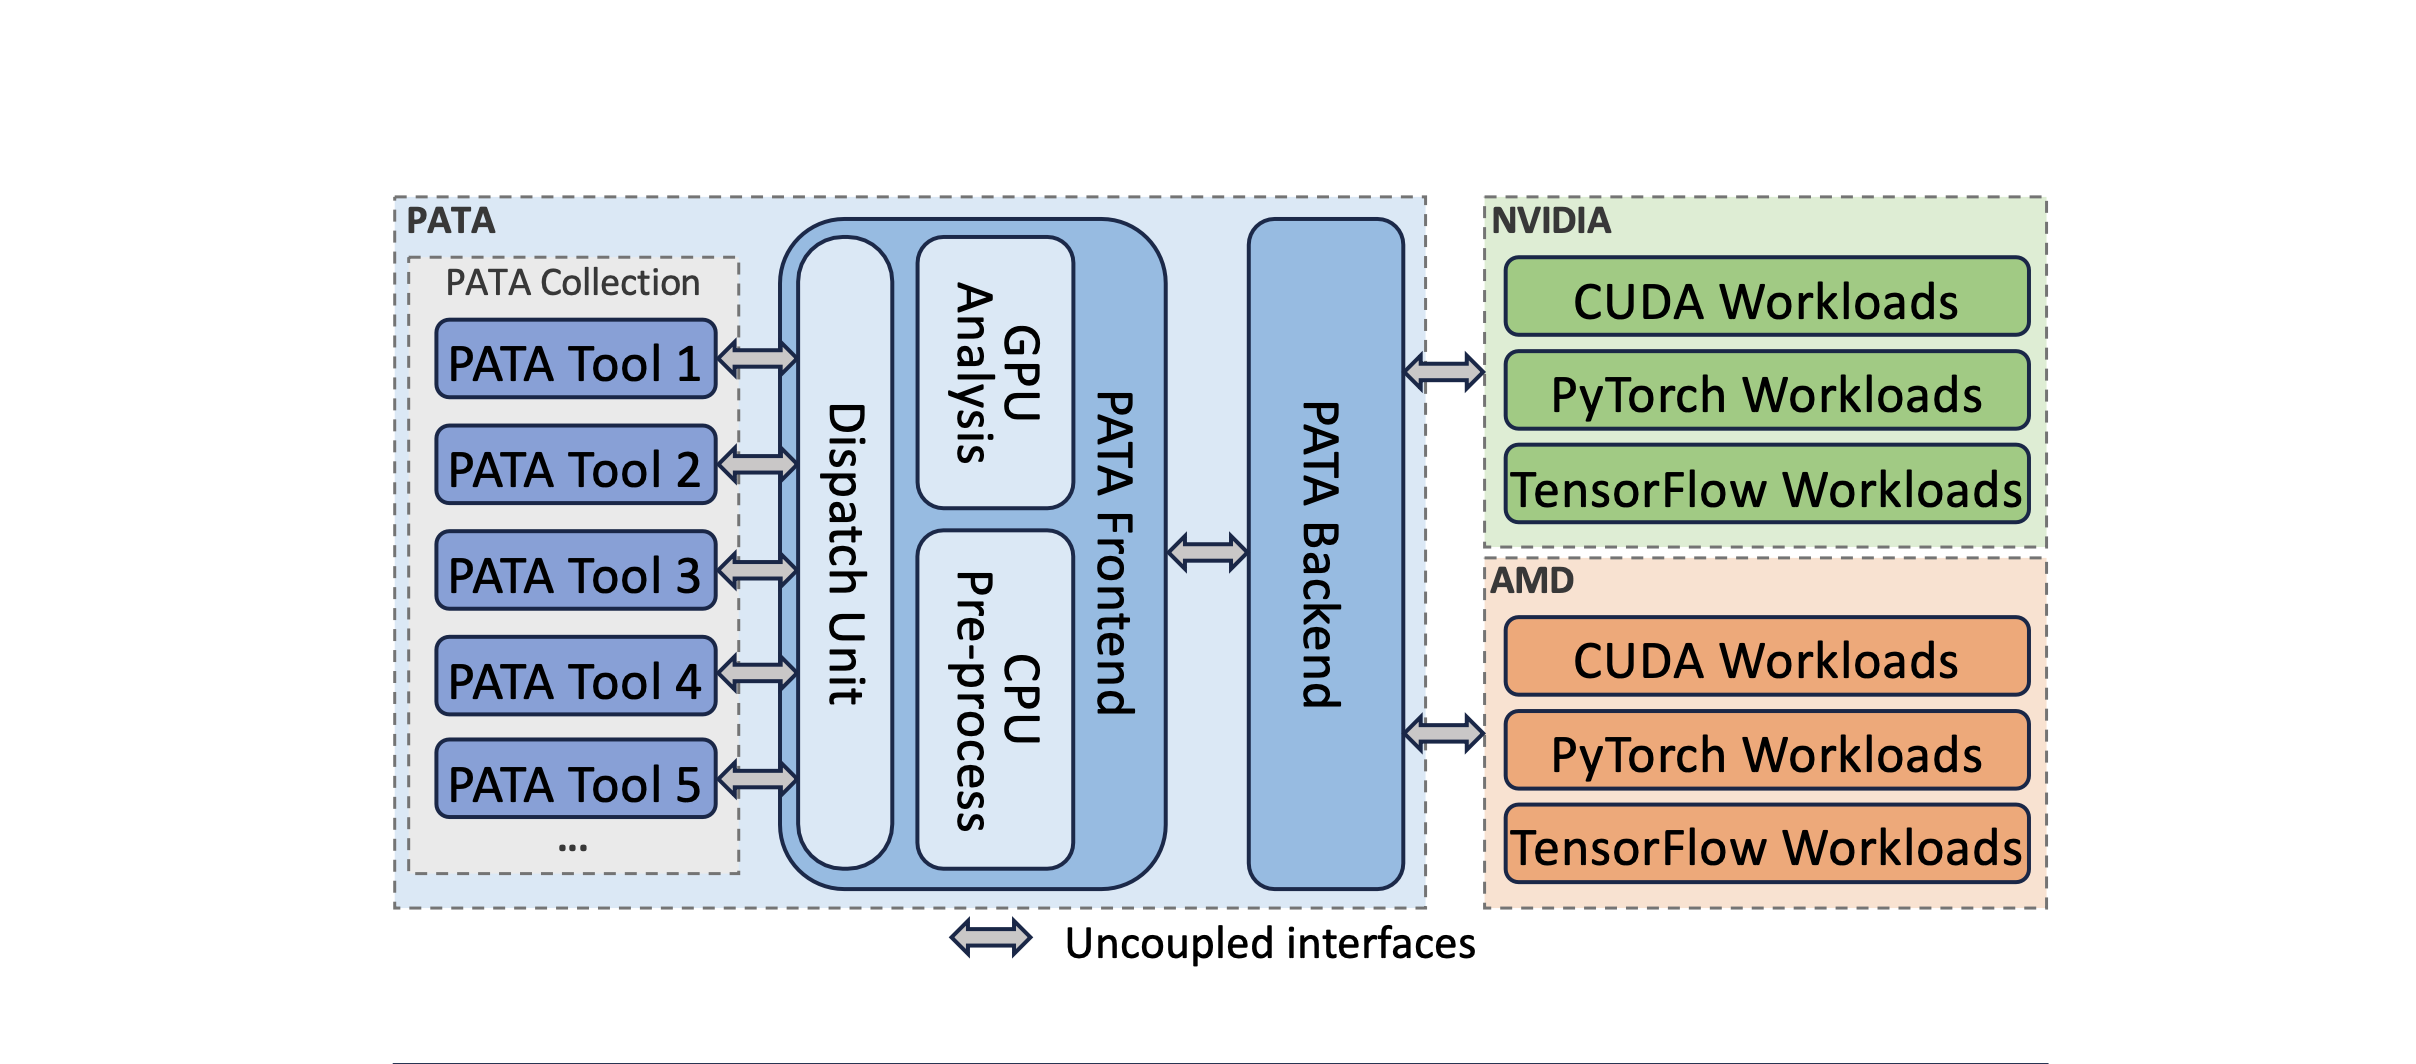
Figure 1: Architecture of the PASTA Framework.
AccelProf is built on top of the PASTA (Program AnalysiS Tool Architecture) framework, which is composed of three core, decoupled components:
Event Handler: Interfaces with vendor-specific profiling APIs and DL framework callbacks to collect runtime data.
Processor: Performs pre-processing of collected data—either on the CPU or GPU—and routes it to analysis modules.
Tool Collection: Hosts a variety of user-defined analysis tools that implement specific profiling features.
This clean separation of responsibilities supports easy extension, flexible integration, and compatibility across vendors and platforms.
Key Features
✅ Modular architecture separating handler, processor, and tool logic
🔄 Cross-vendor support for NVIDIA and AMD accelerators
🧠 Deep learning framework integration, currently supporting PyTorch
⚡ GPU-accelerated in-situ preprocessing (optional but highly efficient)
🎯 Fine-grained instrumentation using annotation APIs (e.g.,
start()/end()wrappers)
Typical Use Cases
AccelProf is suited for a wide range of performance analysis scenarios, including:
🔍 Kernel frequency profiling to identify performance-critical code regions
🚀 UVM memory optimization through fine-grained access pattern analysis
🧩 Operator-level DL analysis to capture tensor allocations, operations, and kernel execution
📊 Custom tool development for research or production use
Whether you’re debugging memory bottlenecks, tuning kernel launches, or analyzing large DL models, AccelProf provides a flexible platform to support your goals.